From Lost Paper Notes to Harvest Intelligence
Self-driven, quick starter, passionate programmer with a curious mind who enjoys solving a complex and challenging real-world problems.
How we replaced notebooks and guesswork with a field-first digital system — and transformed our harvesting business in the process.
Every harvest season looked productive from the outside. Machines moved, teams worked, and fields were covered day after day. But inside the business, a quiet problem was compounding.
At the end of each week, we’d gather around a table covered in notebooks, loose slips, and half-remembered phone conversations, trying to answer questions that should have been simple: Which fields were finished? How much area was covered? What rate was agreed upon? Was payment collected in full, in part, or not at all? And why did the office’s numbers never quite match what actually happened in the field?
These weren’t rare slip-ups. They were systemic. A completed job would go unrecorded. A recorded job would lose its geographic trail. A payment made in instalments would drift out of alignment with the books. In a seasonal business where margins are tight and time is short, each of these gaps translated directly into lost revenue.
That realisation was our turning point. We decided to stop running a growing operation on paper memory and end-of-week reconciliation. Instead, we set out to build a complete system from the ground up — a field-first mobile app, a management web dashboard, and an intelligence layer to guide faster, better decisions.
This is the story of that transformation.
The Real Problem Wasn’t Record-Keeping
Our first instinct was to blame sloppy documentation. But when we studied the workflow closely, we found something deeper. Data was being captured hours or days after the actual work, not in the moment. The field team and the office operated with different versions of the truth. Connectivity in rural areas made conventional digital tools unreliable. Pricing logic varied by job type and crop, but the tools we had were rigid. Collections and dues were tracked reactively, always a step behind. We had reports, but nothing resembling insight.
So we reframed the entire goal. We weren’t building “an app.” We were building an operating system for harvesting operations — one that covered the full arc from job creation in the field to financial settlement in the office, with intelligence layered throughout.
The result is Kandel Krishi: a two-part digital platform with an Android mobile app for field teams and a web dashboard for management. Both share a live backend, synchronise data in both directions, and work together to give every person in the business — field officer, manager, owner — a single, consistent version of operational reality.
The Mobile App — Built for the Reality of the Field
Working Without Signal
The first and most important rule we set for ourselves was this: the app must work whether or not the phone has signal. Full stop.
Our field teams operate across terrain where connectivity is unpredictable. Strong on a main road. Nothing in the middle of a paddy field. So the app stores everything locally on the device first. Jobs, farmer records, payments, expenses — all of it is saved on the phone before anything is sent to a server. If there’s no connection, the work continues without interruption.
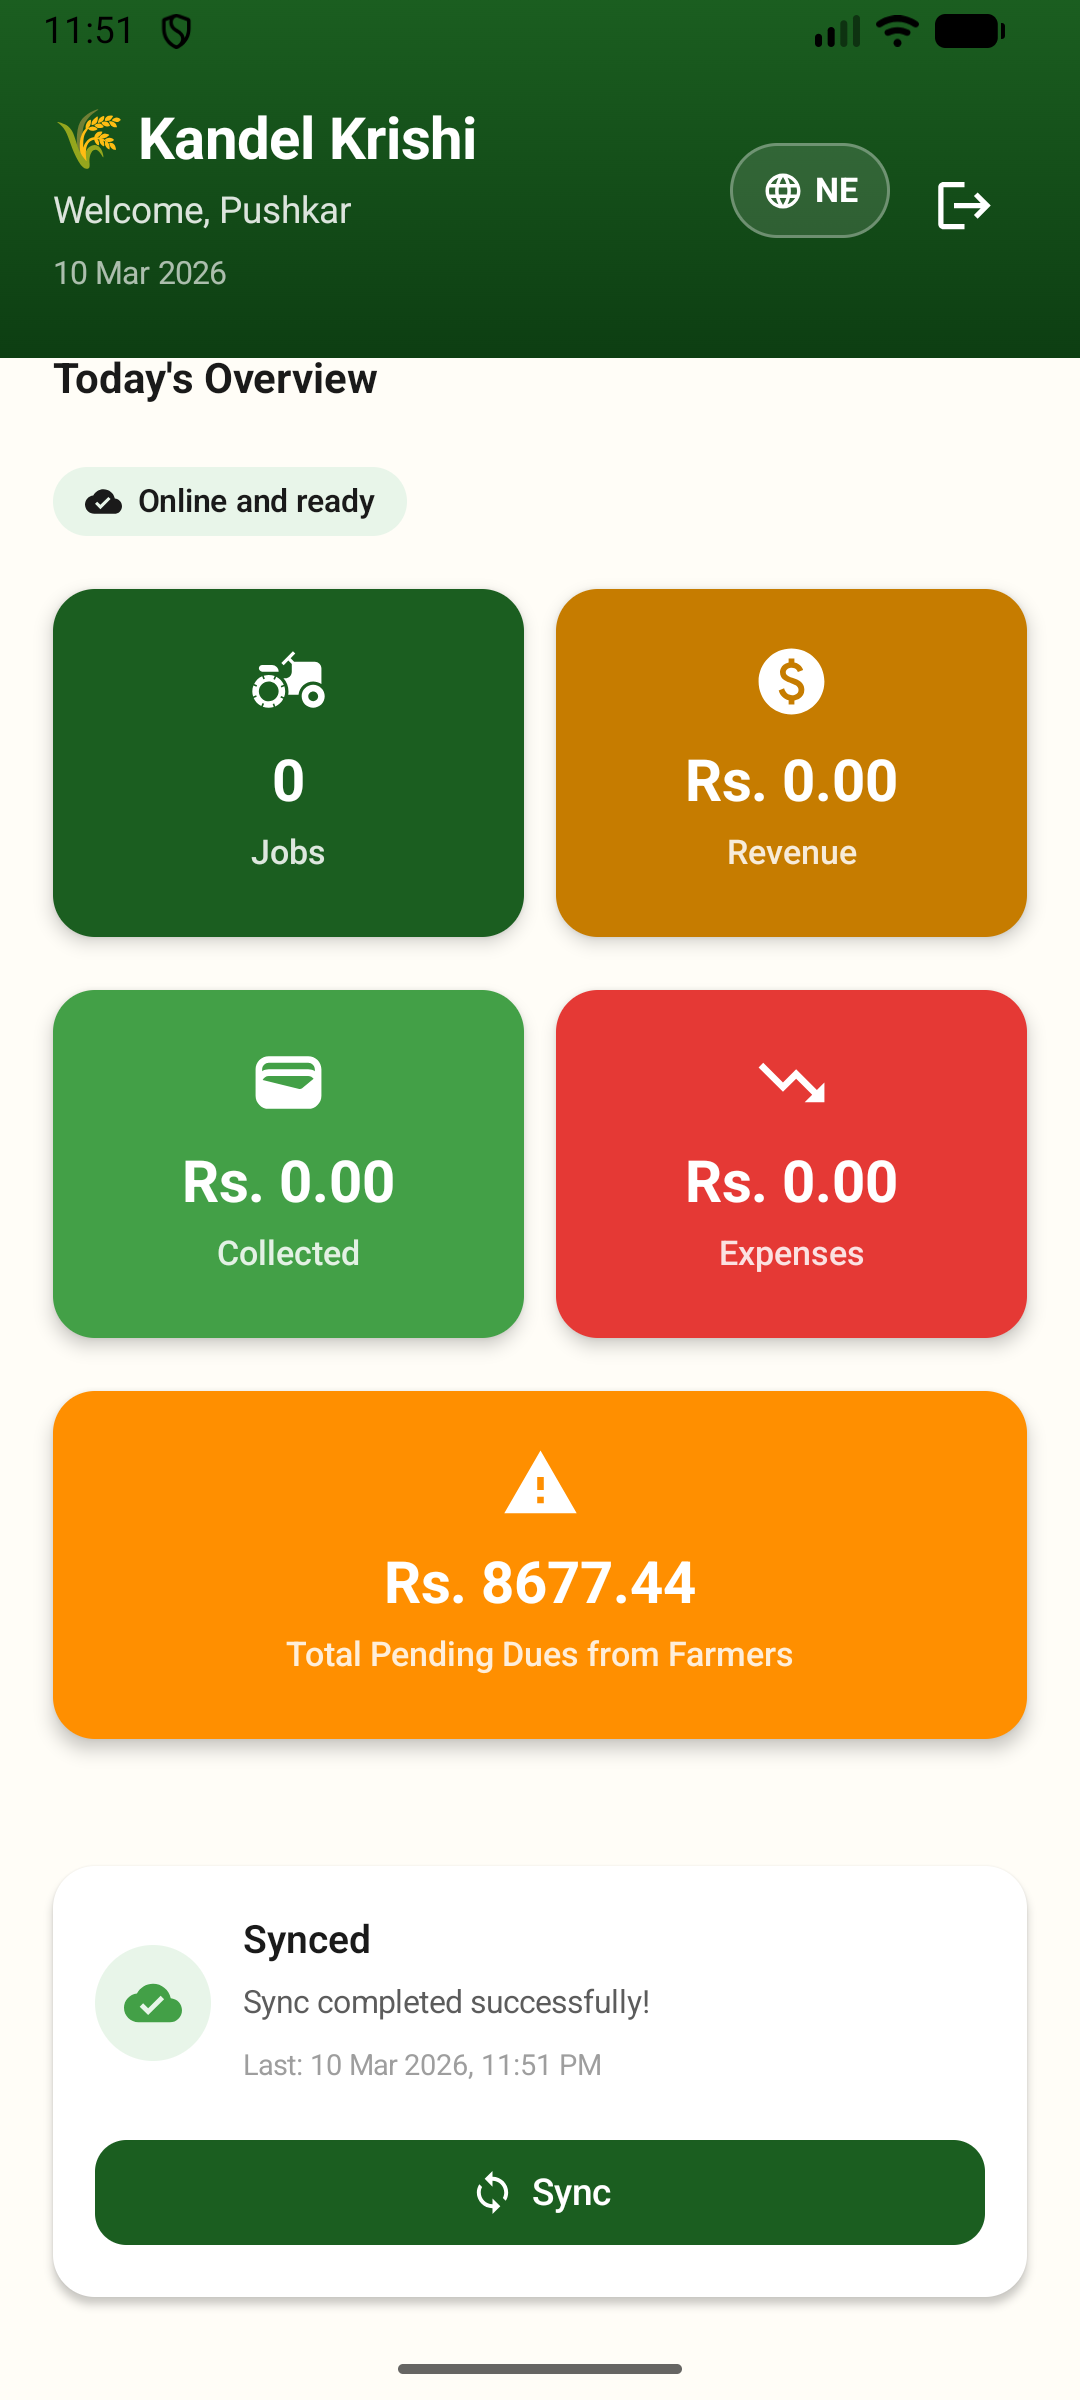
The Kandel Krishi mobile app home screen — showing today’s overview with jobs, revenue, collections, expenses, pending dues, and the one-tap sync feature that keeps field data flowing even from areas with unreliable connectivity.
Synchronisation runs quietly in the background, every fifteen minutes, whenever a network connection is available. Field officers can also trigger a sync manually with a single tap from the home screen. And when someone tries to log out with unsent records still on their device, the app warns them — a small safeguard that has prevented more than a few data losses on a busy close-of-day.
This single decision — to make offline the default, not the exception — immediately reduced missing entries and late updates. Work logged in a field with no signal reaches the server the moment the phone reconnects. Nothing is lost. Nothing is delayed by someone forgetting to fill in a form later.
Farmer Management
The farmer directory is the starting point for all field activity, and we built it to be genuinely useful rather than just a list of names.
Every farmer record holds their name, phone number, address, ward, and village. That location detail — ward and village — does more than just describe an address. It feeds the geographic analytics on the dashboard, building up a picture over time of where the business is operating and where it isn’t. Every farmer profile also carries a complete history of their jobs and payments, visible to any field officer in the field.

The farmer directory in the mobile app — searchable by name or phone, with total dues, individual balances, sync status, and quick access to view or edit each record.
Creating a new farmer takes moments. The form is minimal and validates against duplicate phone numbers so the same person doesn’t get registered twice. Editing is equally quick, and every change is logged with the identity of who made it and when — so the audit trail is always intact.
From a farmer’s profile screen, a field officer can start a new job for that farmer with a single tap, with the farmer already filled in and the workflow continuous. There’s no jumping between screens, no re-entering data.
Job Creation — Capturing Work at the Source
The job creation flow is the core of the mobile app. We designed it to follow the actual sequence of events in the field, not the sequence that feels logical from an office desk.
The field officer begins by selecting the farmer — searching by name or phone number from the local database, or registering a new one on the spot. Then they define the work: what crop, what type of service, and how the job will be priced.

The job creation workflow — farmer selection with GPS tagging, crop and service type configuration, and flexible pricing by area, hour, weight, or bag.
Crop and service types. The officer selects the crop — Rice, Wheat, Maize, Barley, Millet, or Other — and the service — Combine Harvest, Threshing, Cutting, Transport, or Other. These selections flow into the pricing calculation and into the analytics layer on the dashboard, so over time the business builds a data-backed view of where its revenue actually comes from.
Four pricing methods, because harvesting isn’t one-size-fits-all. Different jobs are billed differently, and the app reflects that:
By area — a rate per unit of land, with support for Kattha, Bigha, Hectare, and Acre to match whatever measurement convention is in use in a given area.
By hour — a rate per hour of machine operation, for jobs billed on time.
By weight — a rate per quintal, for jobs where harvest yield determines the charge.
By bag — a rate per bag, for operations where collection volume is the natural unit.
Charges and running total. As the officer fills in the form, the app calculates the bill in real time. The base total is quantity times rate. On combine jobs, husk handling can be added as a separate charge calculated from the area covered. Extra charges and negotiated discounts are applied on top. The officer sees the full bill — exactly what the farmer will be charged — before saving the record. Billing disputes that previously ran back to the office as corrections became dramatically rarer.
Opening payment. If the farmer pays at the time of service — a common practice — the payment is captured in the same workflow, on the same screen, without navigating anywhere else.
Location. Every job is tagged with GPS coordinates at the moment of creation. The app captures the latitude, longitude, and accuracy in metres, and records whether the location came from the device’s GPS or from network-based positioning. If location capture fails — due to a denied permission or a genuine signal gap — that is recorded too, so the office knows the difference between a job with no location and a job where location capture was impossible. Geographic ambiguity had been the root of many payment disputes. With every job pinned to a coordinate, that ambiguity is gone.
Payments — Matching How People Actually Pay
Rural payment behaviour doesn’t fit a single pattern, and the payment screen was built to reflect that.
Five payment methods are supported:
• Cash — the most common method, captured with the amount and the receiving officer’s name.
• Online transfer — for bank transfers and mobile wallets. A reference number field ties the payment to the external transaction, so there is always a traceable link between the system record and the actual bank movement.
• Cheque — with reference number tracking.
• Credit — for deferred settlement. Recording a credit payment creates a due without a cash movement, keeping the accounts accurate even when money changes hands later.
• In-Kind — for harvest-share settlements, where the farmer pays with a portion of the crop rather than cash. The officer enters the crop type, quantity, unit, and the agreed rate per unit. The system calculates the monetary value so that every in-kind settlement is financially structured and sits alongside cash payments in the accounts.
For digital payments, the app generates a FonePay QR code — a dynamic code tied to the exact amount owed on the specific job, with a reference remark that makes every transaction identifiable. The farmer scans the code with any FonePay-compatible app. The officer captures the reference number once the transfer confirms. Nothing about the collection depends on memory.

The payment collection screen — showing due amount with late interest breakdown, quick-pay options, five payment methods including FonePay QR for instant digital collection.Test caption for dashboard
Before recording a new payment, the officer sees the farmer’s full payment history and outstanding balance. Quick-pay options for the full amount or half the amount reduce the time spent on data entry for the most common collection scenarios.
The Sync Queue — Knowing What’s Pending
The sync queue screen gives field officers visibility into the state of their own data. It shows which records are waiting to be sent to the server, which have failed and why, and how many times each has been retried. A single button triggers an immediate sync. This transparency means officers always know whether what they’ve logged today is on the server — and managers always know whether the dashboard numbers reflect the latest field activity.
The Web Dashboard — One View of the Whole Business
Once field capture became reliable, we needed a single place where operations, finance, and management could see the same truth, at the same time. That became the web dashboard.
The Home Screen — Live, Not Summarised
The dashboard opens on an executive overview designed around a single question: what does the business look like right now?
Eight live metrics appear across the top of the screen, each reflecting the current state of operations:
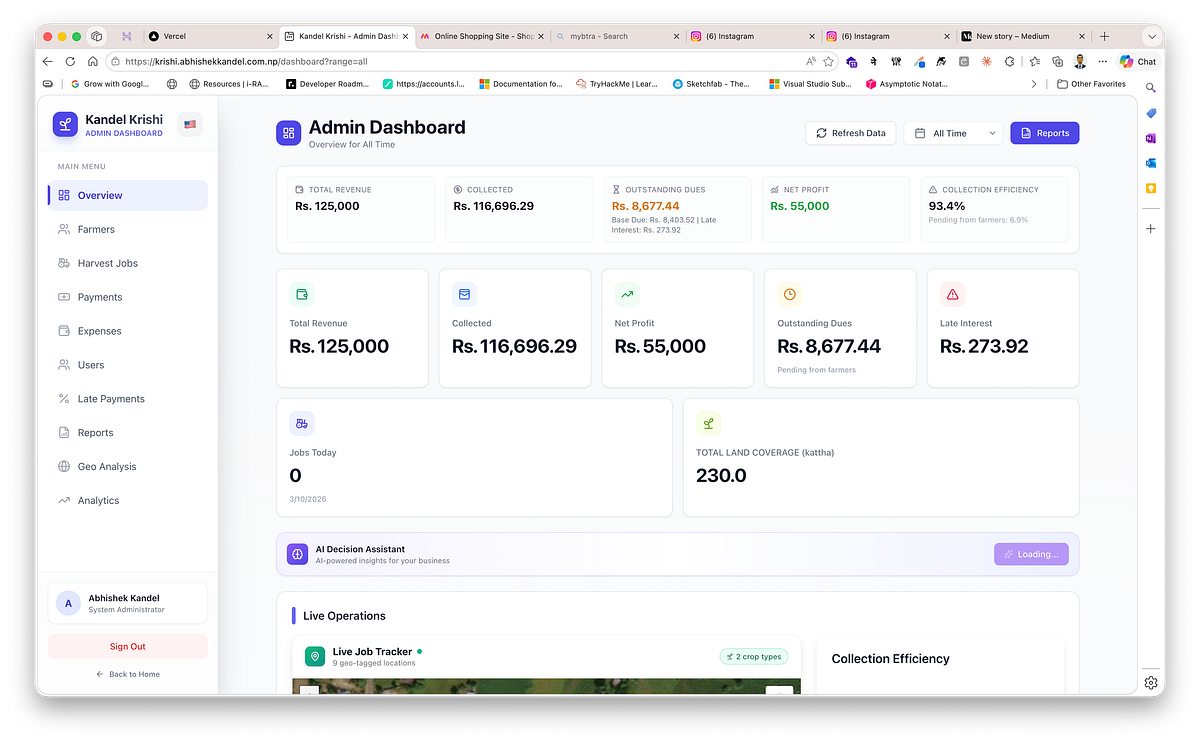
The web dashboard home screen — live KPIs for revenue, collections, dues, expenses, and profit, alongside an AI decision assistant and live operations map.
• Total Revenue — the gross amount billed across all jobs.
• Total Collections — all verified payments received.
• Outstanding Dues — the unpaid balance across active jobs.
• Late Interest — accrued interest charges on overdue accounts.
• Total Expenses — all recorded operational costs.
• Net Profit — collections minus expenses.
• Jobs Today — harvest jobs created or updated in the current day.
• Land Covered — total area serviced across area-based jobs.
Each metric shows a growth percentage against the previous period, based on whichever time window — seven days, thirty days, or ninety days — the manager has selected.
Below the metrics, the home screen runs three sections simultaneously.
Live operations. A map showing every geo-tagged job location, updated as field data syncs in. Beside it, a real-time activity feed listing the ten most recent events across the business — jobs logged, payments received, expenses recorded — with the officer’s name, the amount, and the timestamp. Leadership no longer waits for a manually compiled end-of-day summary. The picture is always current.
Financial charts. A daily line chart tracking billed revenue against collected payments, so the gap between what is owed and what has actually come in is visible every day. A service-type chart shows which operations — Combine Harvest, Threshing, Cutting, Transport — are generating the most revenue. A crop distribution panel breaks down volumes by crop type.
Performance. A top-five farmers table ranked by total revenue billed. A field officer performance panel showing each officer’s job count, assigned amount, collected amount, and collection efficiency — expressed as a percentage of assigned that has been collected.
Two AI-powered panels load in the background and appear once ready: a recommendation strip surfacing the three most actionable insights for the day, and a geographic summary showing the business’s coverage score across wards and flagging any gaps.
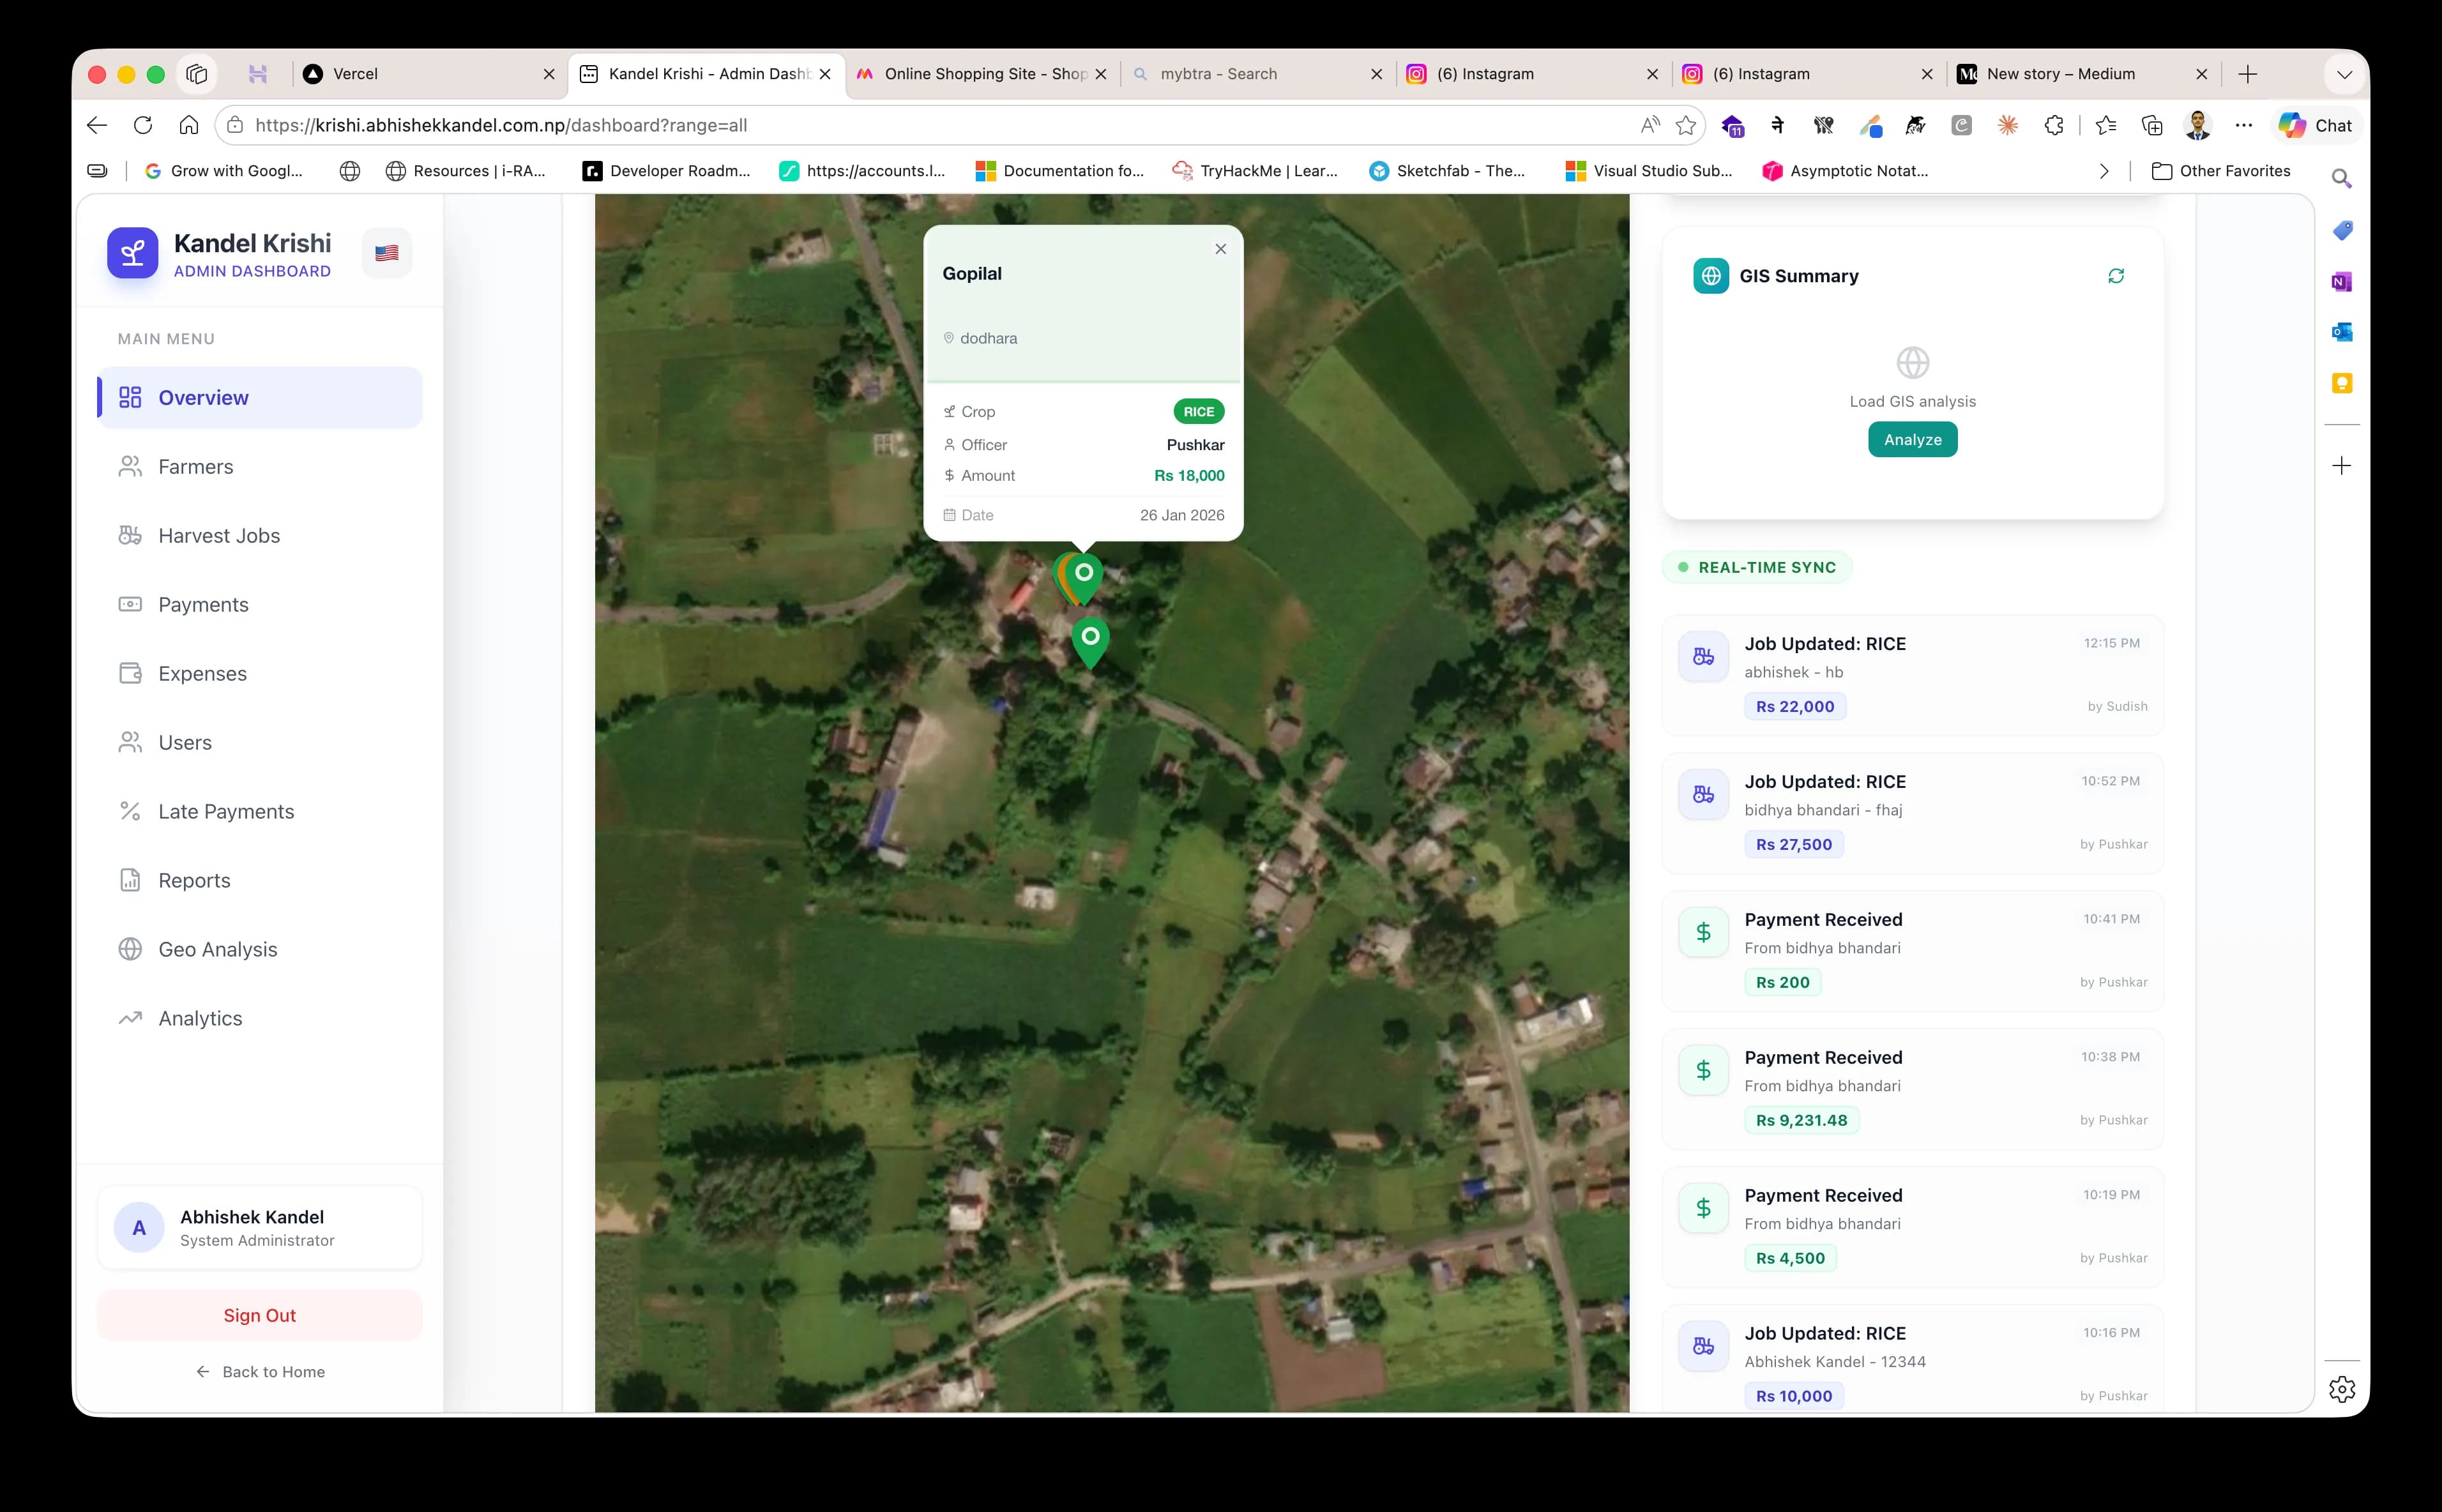
The Live Job Tracker — Every Job on a Map
The Live Job Tracker is an interactive map showing all geo-tagged job locations for the selected date range.

The Live Job Tracker — an interactive map with colour-coded pins by crop type, job detail popups, GIS summary, and a real-time activity feed.
Each pin is colour-coded by crop type — green for paddy and rice, yellow for wheat, orange for maize, blue for vegetables, purple for fruits, teal for others. Clicking any pin opens a popup showing the farmer’s name, village, crop type as a coloured badge, assigned officer, billed amount, and job date. A floating legend in the map’s lower corner shows the crop colours currently represented. A stats bar below the map shows the total job count, number of unique villages, and total revenue — large numbers formatted in lakhs for readability.
A pulsing green dot in the panel header signals that the data is live.
Switching between a street map layer and a satellite imagery layer is a single click.
Jobs Management
The jobs module is a searchable, filterable view of all harvest operations. Quick filters surface the most useful subsets without any setup: all jobs, today’s jobs, this week’s jobs, or pending (unpaid) jobs. Search runs across farmer name and phone number.
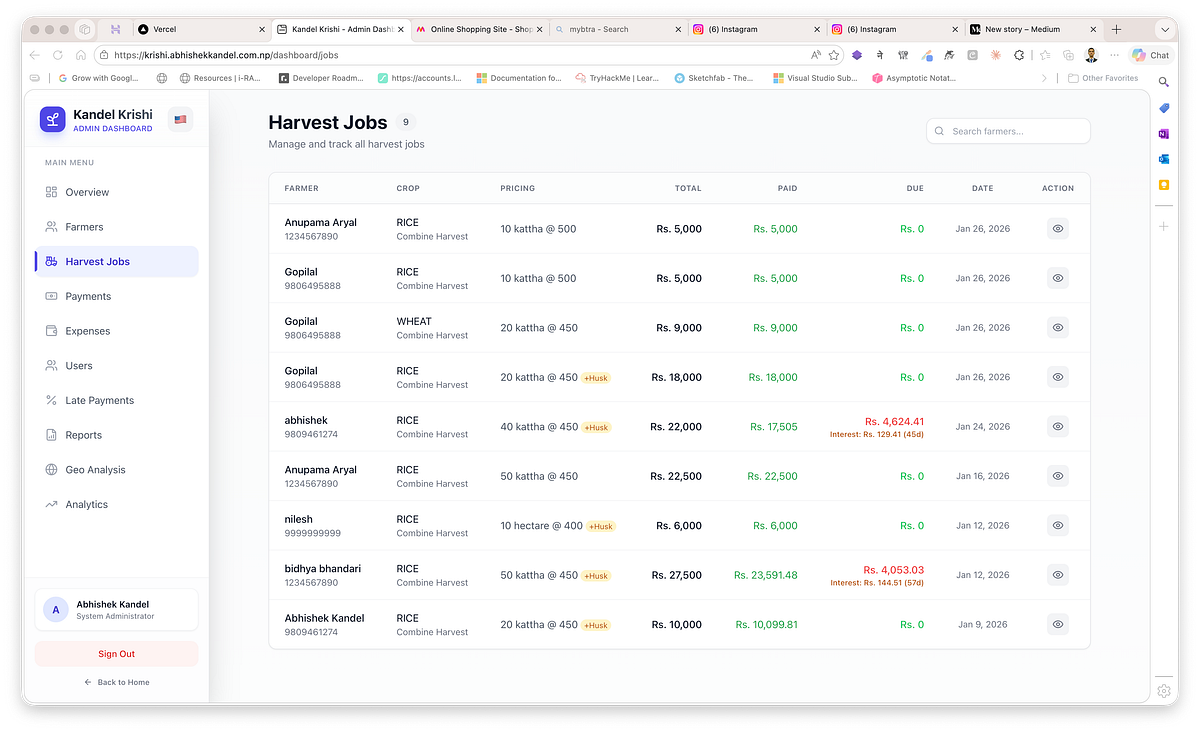
The Harvest Jobs management table — searchable and filterable by date, status, and farmer, with real-time totals, dues, and late interest highlighted per job.
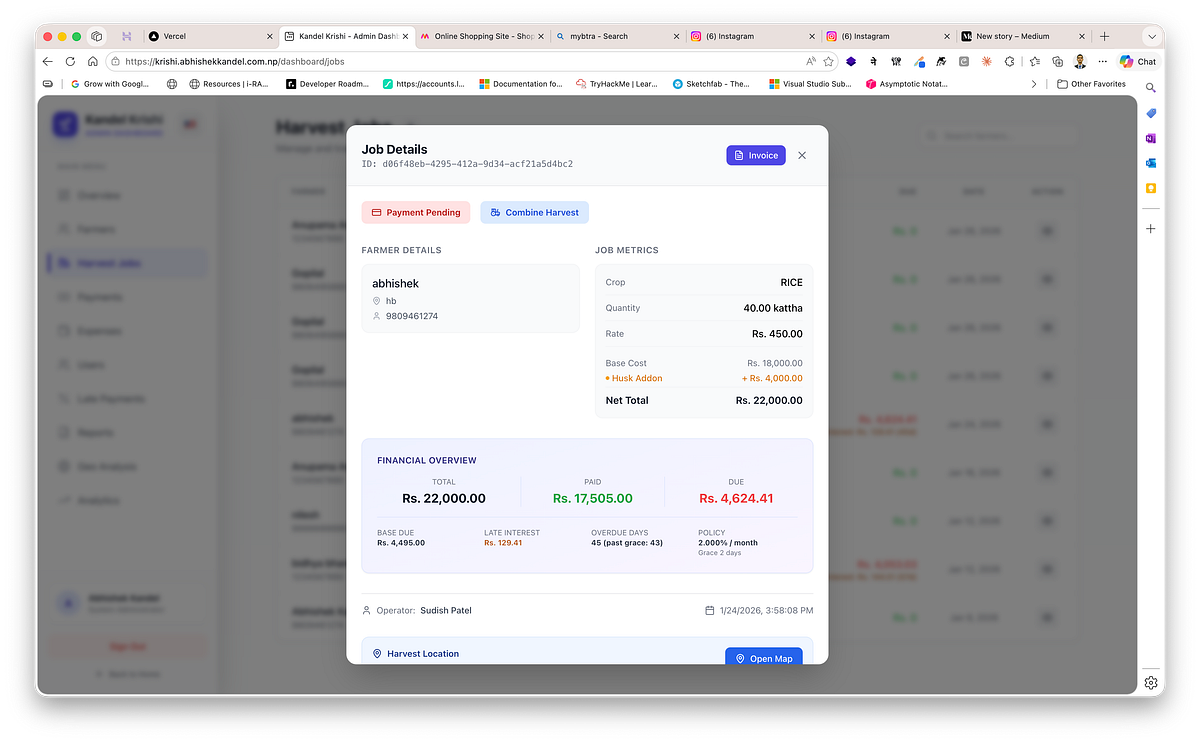
Job detail view — full pricing breakdown with farmer details, job metrics, financial overview including late interest, overdue tracking, and harvest location link.
Clicking any job opens a full detail view showing the complete pricing breakdown — quantity, rate, base total, husk charges if applicable, extra charges, discount, gross total, amount paid, and amount still due. Where a late payment policy is in effect, the detail view also shows the base due amount, the accrued interest, the number of days overdue, and how many days have elapsed beyond the grace period.
There is no manual estimation involved. The figure a farmer owes is always the correct, policy-driven number — compounded monthly from the day the grace period ended.
Farmers Directory
Opening the farmers module shows every registered farmer alongside their aggregated financial position: total billed across all jobs, total collected, total outstanding including any accrued late fees, and job count. The list is searchable and sortable by any column.

The Farmers Directory on the dashboard — every registered farmer with their aggregated financial position, total billed, paid, outstanding dues, and job count.
Opening a farmer’s profile shows their complete job history, payment records, and a cumulative financial summary. From that screen, the office can generate a printable farmer statement or a payment invoice — making every customer conversation credible because it is backed by a complete, current record rather than a best estimate.
Payments Log
The payments module shows every payment transaction across the business: amount, payment method, reference number where applicable, the officer who received it, and the time it was recorded. Today’s total collection appears as a KPI at the top of the screen. Searching by farmer name or phone number narrows the list instantly.
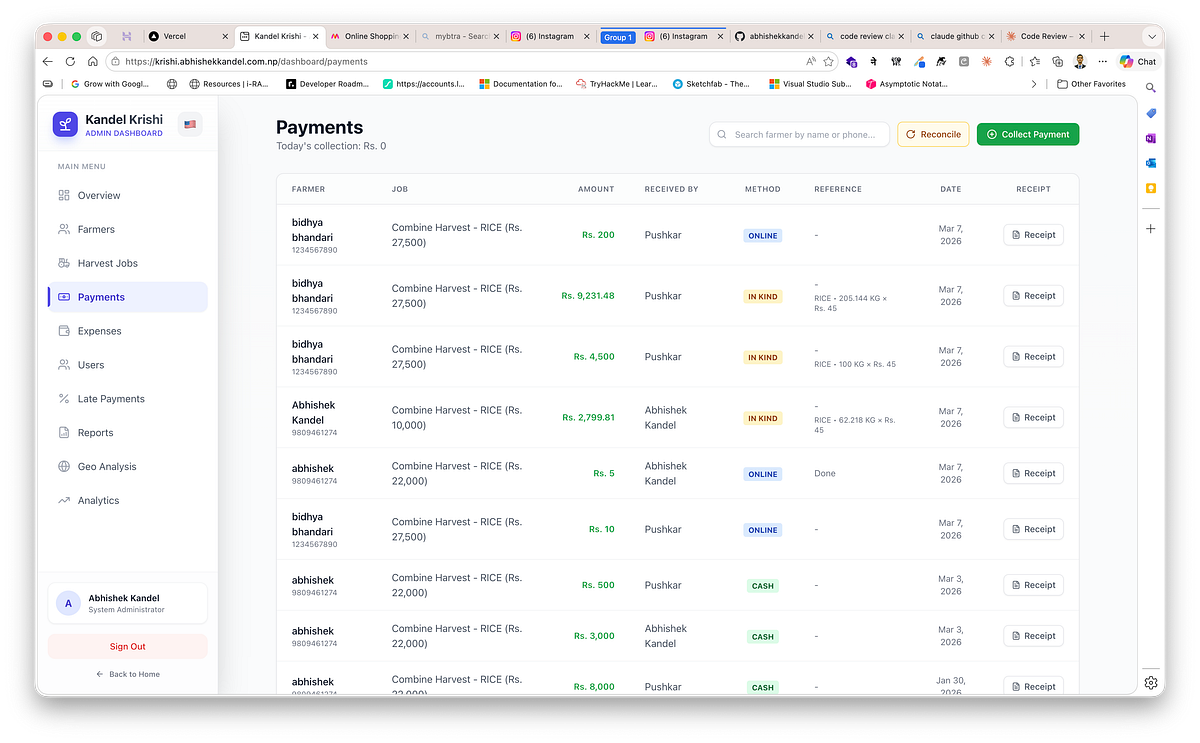
The Payments Log — every transaction with amount, method, receiving officer, reference number, and reconciliation tools for continuous financial accuracy.
Admin users have access to payment reconciliation tools — controls for identifying and correcting mismatches between field-reported payments and office-verified receipts. Reconciliation went from a high-stress end-of-season exercise to a routine, continuous process.
Expenses
The expenses module captures every operational cost — fuel, repairs, wages, materials — with the category, amount, date, description, and the user who recorded the entry.

Expense Tracking — total expenses, monthly trend chart, category breakdown, and per-user cost attribution for continuous visibility into operational costs.
Four summary numbers run across the top: total expenses all-time, this month’s total, the daily average for the current month, and the count of expense entries.
Below those, three analytical views: a daily expenses trend chart, a category breakdown showing which types of cost are growing fastest, and a per-user breakdown showing what each field officer has recorded. Hidden operating costs that previously only became visible at season close are now tracked continuously.
Late Payment Policy
Consistent late-fee treatment used to require someone to remember the rules and apply them manually. Now it is configured once and enforced automatically.

Late Payment Settings — configurable grace period, monthly interest rate, and a live preview calculator, enforced automatically across all devices.
The admin settings screen has four controls: an on/off toggle for the late fee system, a grace period in days, a monthly interest rate to two decimal places, and an example calculator that shows exactly what a given amount owed after a given number of overdue days would become under the current settings. The policy is pushed to every mobile device on the next sync, so field officers and the office always see the same figures. There is no version drift, no inconsistency, no awkward conversations about whose numbers are right.
Analytics — From Showing Data to Guiding Decisions
Digitising operations gives you data. The analytics layer turns that data into decisions.
Profitability and Finance
A monthly profit-and-loss chart plots gross revenue against total expenses month by month, showing actual margin rather than estimated margin. A strategic insights panel surfaces the collection rate and profit margin percentage and flags when either falls below a healthy threshold.

Executive Analytics — net profit, collection rate, total dues, profitability trends, and strategic recommendations for data-driven financial decisions.
A payment method mix chart shows what proportion of collections are coming in as cash, online transfer, cheque, credit, and in-kind — a direct input for cash-flow planning. A debt aging report sorts outstanding dues into four time brackets: 0–30 days, 30–60 days, 60–90 days, and over 90 days. Accounts in the over-60 bracket are highlighted automatically.
An expense category breakdown makes the composition of operating costs visible early. A pricing analysis table shows the average rate achieved per service-and-crop combination, so management can benchmark whether negotiated rates across the portfolio are consistent or drifting.
Operations and Geography
A ward revenue heatmap ranks the top twelve administrative wards by revenue generated, showing where the business is densest. A village revenue breakdown does the same for the top fifteen villages. An operator efficiency chart plots each field officer’s job count against their revenue output. A geo coverage map visualises GPS-tagged job density across the operating area, making coverage gaps immediately obvious rather than abstractly described.
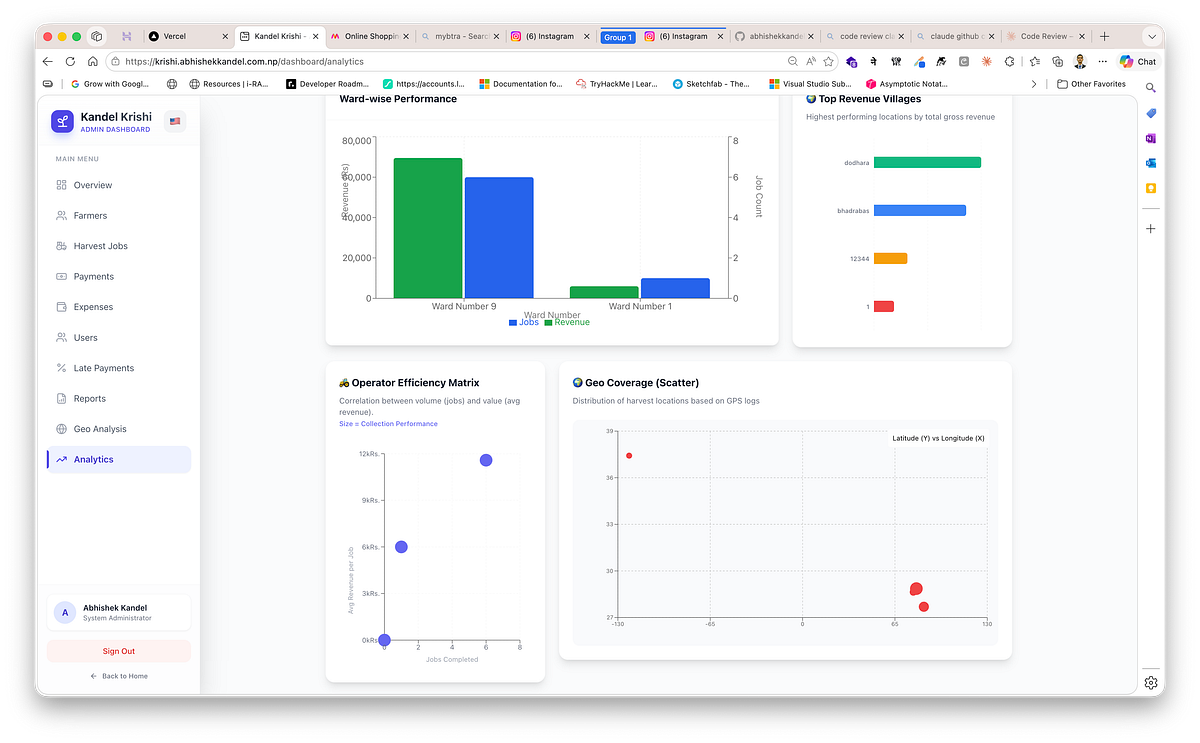
Operations and Geography analytics — ward-wise performance, top revenue villages, operator efficiency matrix, and GPS-based geo coverage scatter plot.
Advanced Analytics
Farmer Lifetime Value ranks the top hundred farmers by cumulative revenue, assigns Gold, Silver, and Bronze tier labels by revenue percentile, and shows the LTV alongside job count and average transaction size for each. The most valuable relationships are always visible.
Credit risk scoring gives each farmer a score from 0 to 100 based on outstanding dues, overdue job count, and payment behaviour. Farmers above a risk threshold are surfaced for collection attention before the end of a season — not after.
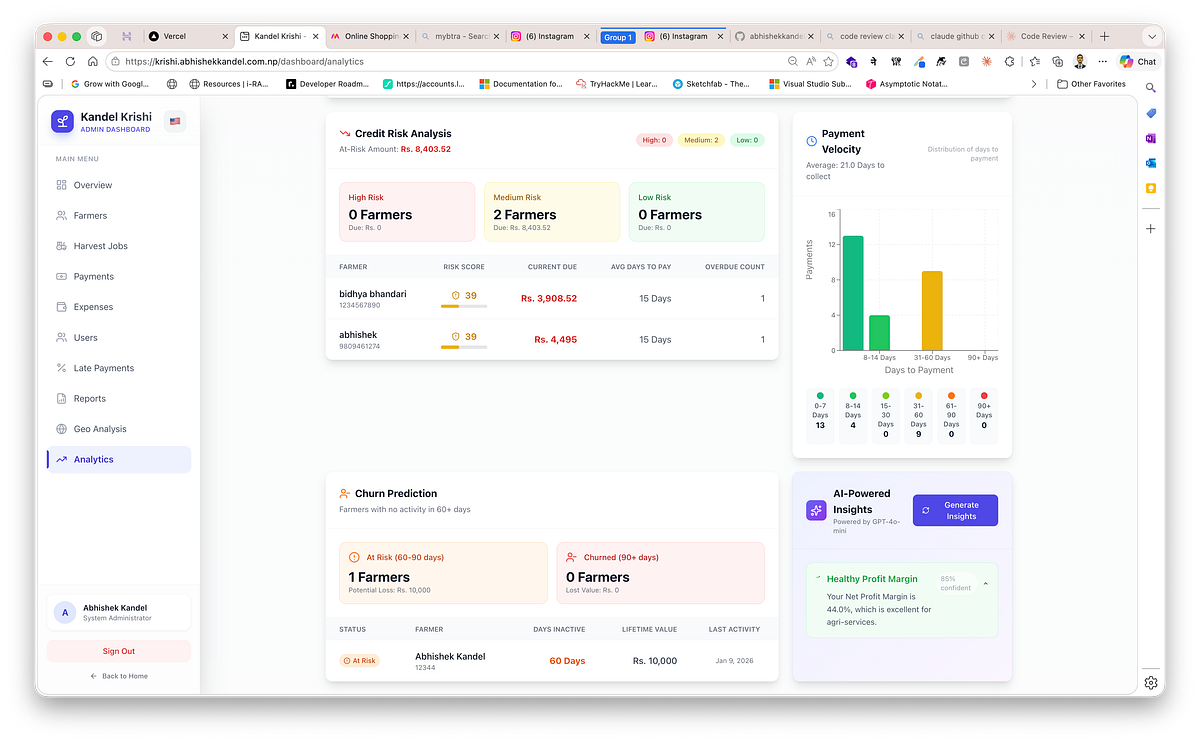
Advanced Analytics — credit risk scoring, payment velocity distribution, churn prediction, and AI-powered insights for proactive collection and retention.
Payment velocity charts how long farmers take to pay after job completion. The distribution across time buckets — under a week, one to two weeks, two to four weeks, one to three months, over three months — reveals systemic slow-pay patterns that should inform collection policy.
Churn prediction identifies farmers who have been inactive for sixty or more days and classifies them as At Risk or Churned, enabling re-engagement before a relationship is permanently lost.
AI Decision Intelligence
The intelligence layer surfaces structured, ranked guidance — not open-ended observations.

AI Decision Intelligence — priority actions ranked by urgency and financial impact, with business health score, projected revenue, and risk warnings.
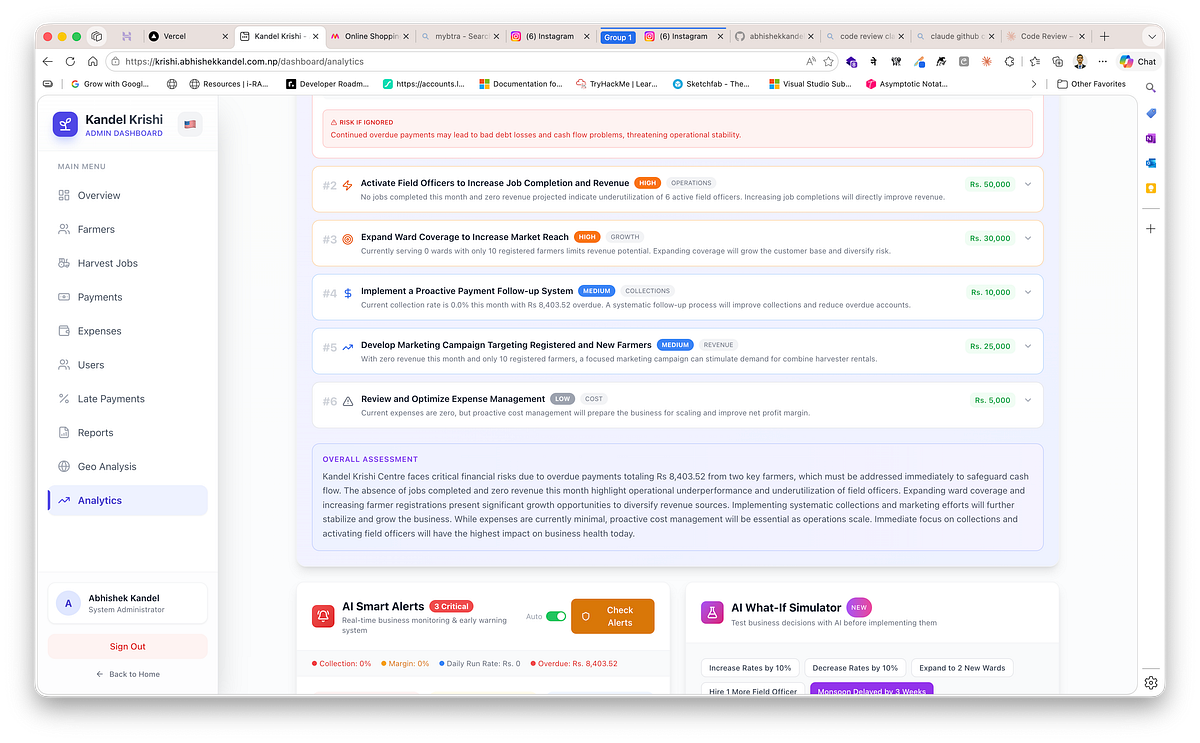
Full recommendation list with overall assessment, AI Smart Alerts for anomaly monitoring.
Decision Hub presents the day’s most important recommendations, ordered by urgency and expected financial impact, each with a confidence rating and a specific suggested action. A manager reviewing this at the start of a day knows precisely what deserves immediate attention and what can wait.

Smart Alerts with categorised warnings and actionable steps, alongside the What-If Simulator modelling a monsoon delay scenario with projected financial impact.
Smart Alerts flags anomalies across operations and collections: unusual payment gaps, revenue falling short of forecast, collection efficiency dropping below a threshold, an expense spike in a category, or a high-value account entering the overdue range.
Scenario Simulator lets management model a proposed change before committing to it. What happens to collection revenue if the standard rate rises by five percent? What does the outstanding balance look like in thirty days at the current collection rate? The simulator returns structured projections with estimated financial impact for each scenario.
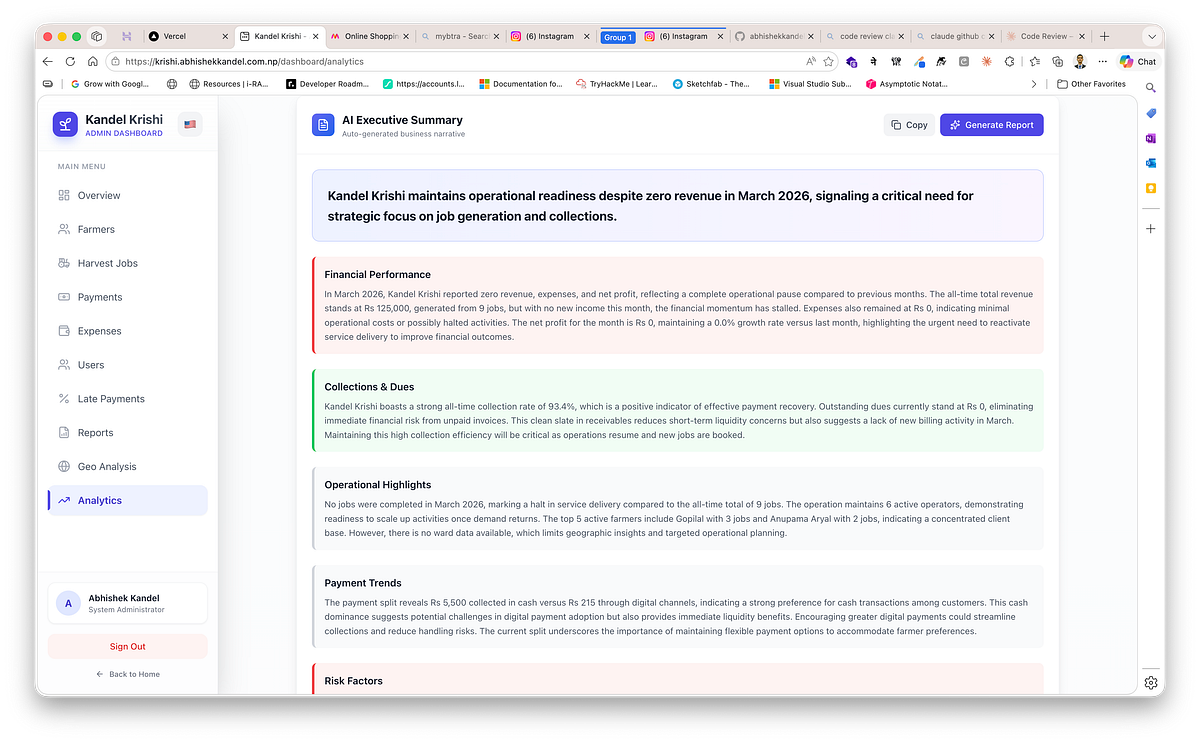
A consolidated executive summary highlighting financial performance, collections status, operational insights, and key risk indicators — giving leadership a quick view of current operational health.

Interactive forecasting and trend analysis tools visualize historical revenue patterns, project future performance, and explain the drivers behind changes in operational and financial metrics.
Revenue Forecasting uses the historical pattern of jobs and collections to project the upcoming period — giving planning a quantitative anchor rather than a best guess.
Trend Analysis explains why numbers are moving, not just that they moved. Whether a revenue increase reflects more jobs, higher rates, improved collection, or a seasonal shift — the system identifies the driver.
Goal Tracking allows management to set targets and receive progress updates comparing actuals to stated goals as the period unfolds.
Anomaly Detection flags statistically unusual events: a day with far fewer jobs than the period average, a payment amount far outside a farmer’s historical range, a sudden concentration of activity in an area that was previously quiet.

Management dashboards track progress toward revenue goals while automatically identifying unusual operational patterns, payment anomalies, and emerging financial risks.
GIS Intelligence analyses ward- and village-level coverage patterns, identifies service gaps, flags dense areas for route optimisation, and surfaces geographic expansion opportunities the business might otherwise overlook.

GIS Intelligence Dashboard
AI Report Generator synthesises all of the above into a written report on demand — executive summary, financial review, operational assessment, and strategic recommendations — in English or Nepali, whichever the manager prefers.
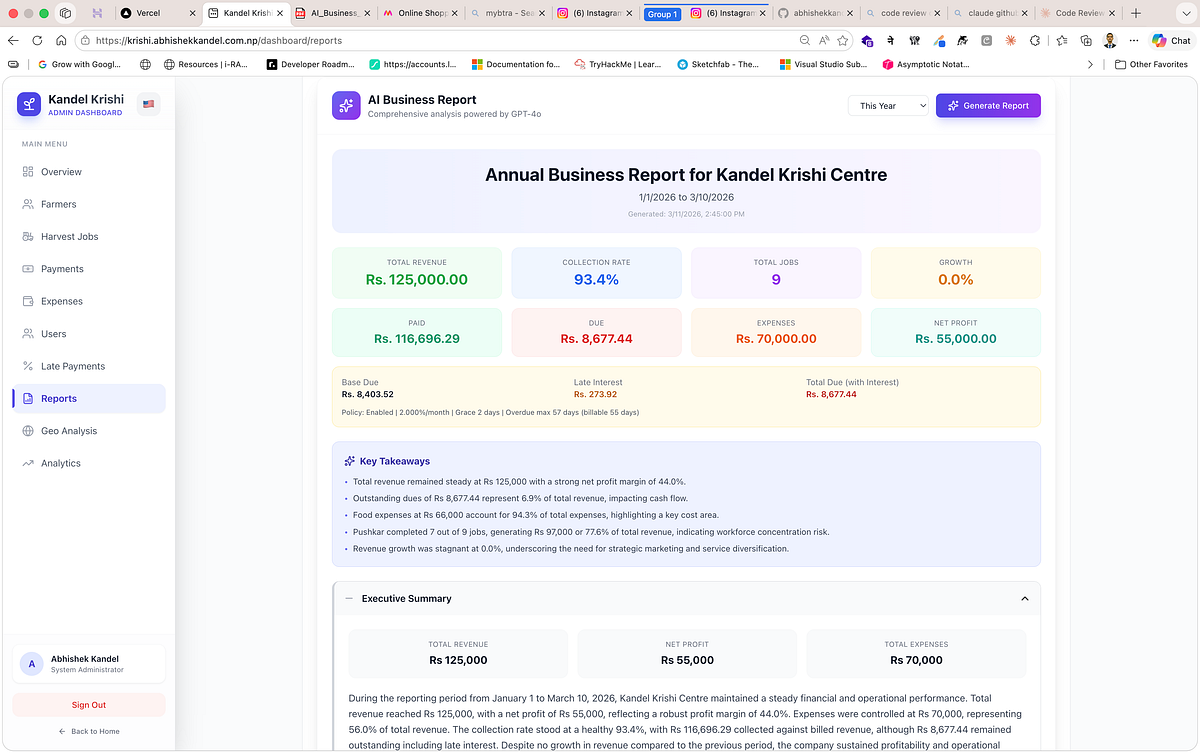
Automatically generated management report summarising key financial indicators, operational performance, and executive insights for quick review
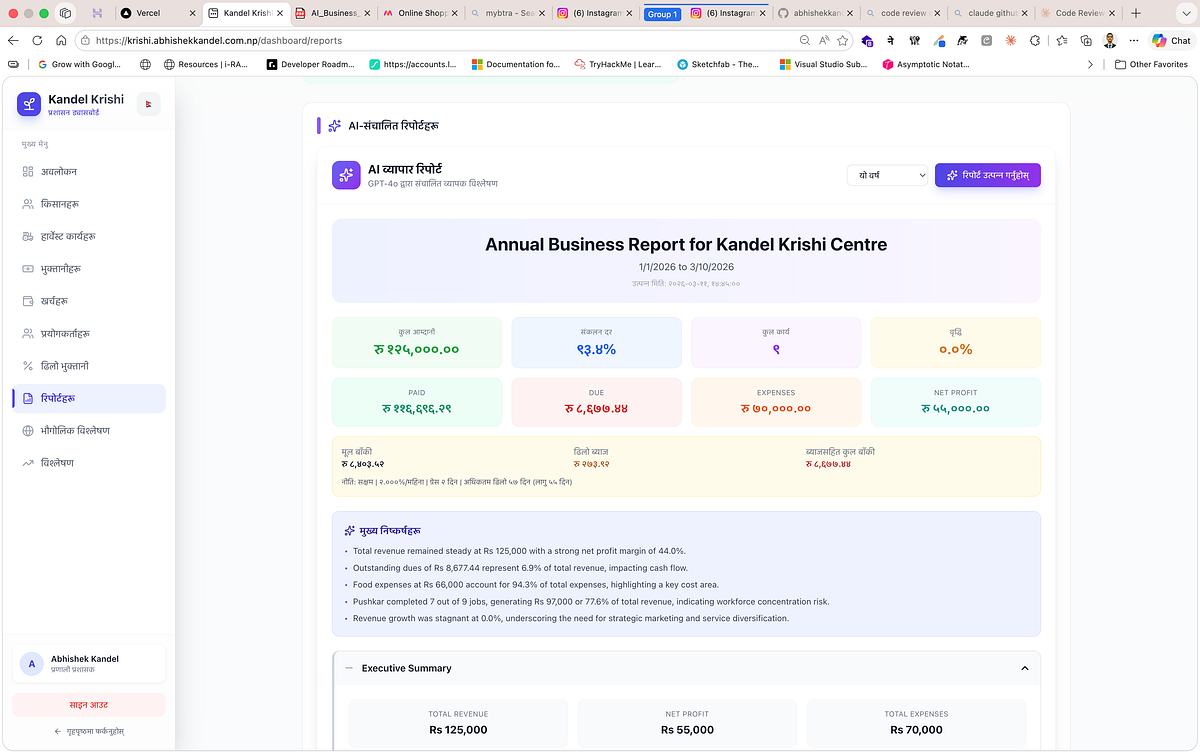
AI-Generated Business Report (Nepali)
SWOT Analysis frames the business’s current data as a structured Strengths, Weaknesses, Opportunities, and Threats assessment, ready for a board review or planning session.

AI-assisted SWOT analysis converts operational and financial data into a structured assessment of strengths, weaknesses, opportunities, and threats for strategic planning.
Reports and Export
The reports section turns live data into formatted documents for sharing, printing, and official filing. Every report type supports a date-range filter — seven days, thirty days, ninety days, six months, a year, all time, or a custom range — and a payment-method filter.
Six reports are available:
Daily Collection Report — day-by-day payment totals, broken down by officer and method.
Outstanding Dues — a complete list of every farmer with an unpaid balance, with job-level detail. The dues report also supports a four-page printable invoice format with a FonePay QR code embedded, so the office can hand a farmer a professional bill and accept payment on the spot.
Officer Ledger — a per-officer summary of jobs assigned, amount billed, amount collected, and outstanding balance.
Expense Report — every expense entry with category, user, and date.
Profit and Loss Statement — monthly revenue, expenses, and net margin in a clean financial format.
Pending Billing Invoices — all unpaid jobs formatted as individual invoices, each with a FonePay QR code for on-the-spot digital collection.

Automatically generated pending billing invoices formatted for printing or digital sharing, each including a FonePay QR code to enable instant on-site payment.
All reports export to PDF. The work of compiling reports manually disappeared, and confidence in official numbers rose because every document traces directly back to the same live database that the dashboard reads from.
Users, Roles, and Accountability
Three roles structure who sees what and who can do what.
Admins have full access to every module — user management, late-payment policy configuration, payment reconciliation, and system setup. They are the people responsible for how the system behaves, not just how it is used.
Managers can view all operational data, generate reports, access the full analytics suite, and manage farmers and jobs. They cannot change system policy or manage other users.
Field Officers can create jobs, record payments, add expenses, and view their own work. They cannot see other officers’ records, access analytics, or generate reports.
Every record in the system carries the identity of who created it and when. Every edit carries the same. Accountability is not imposed on top of the workflow — it is part of the workflow.
What Actually Changed
The most important outcome isn’t the software. It’s the shift in how the business actually operates.
In the field, work is logged at the moment it happens. Location-backed records have eliminated geographic ambiguity. Offline conditions no longer block reporting. Field teams and the office share a single, synchronised timeline.
Financially, collections are captured faster because the payment screen is always in the field officer’s pocket. Due tracking is accurate because every job carries a live, policy-driven balance. Late-interest treatment is consistent because the rules are centralised and automatically applied. Reconciliation is a continuous, controlled process rather than a seasonal crisis.
For management, leadership sees live KPIs without waiting for a manually compiled summary. Reviews are grounded in system data rather than recollection. Performance conversations are specific and evidence-based.
Strategically, the business now has continuity between field execution, financial tracking, and forward planning. Data is no longer something to compile at the end of a season. It is an asset available every day — for pricing decisions, collection policy, resource allocation, and identifying where to grow next.
A Final Thought
Our original pain was simple. Jobs were getting done, but value was leaking because records were fragmented, delayed, and disconnected.
By linking mobile execution, dashboard control, and intelligence insights into one system, we created an environment where every significant event in harvesting operations — from job creation to final payment — can be captured, synchronised, verified, and acted upon.
The field officer who logs a job in a paddy field with no signal and the manager who checks the morning dashboard from the office are now looking at the same data, in the same state, with the same confidence. That shared operational reality — which simply did not exist two seasons ago — is the real product of this work.
This transformation didn’t come from working harder. It came from changing the system.

Initial system setup interface for Kandel Krishi, where the database schema is created and the administrator account is configured before the platform becomes operational.
If your field business still runs on notebooks, delayed entries, and spreadsheet reconciliation, the hidden cost is almost certainly larger than it appears. And the answer isn’t simply digitisation. It’s end-to-end operational intelligence — the ability to capture work in the moment, synchronise it reliably, understand it analytically, and act on it decisively.
That’s what we built. And it changed everything.